
Dashboard
In supply chain organizations, workforce analytics and just-in-time data have become essential tools. Real-time visual insights are critical for operational and strategic decision making for the modern businesses. Tracking specific KPIs that are relevant to your business covey a very important story. Organizations can focus on a particular activity, track performance, and obtain a big picture of their overall supply chain operations.

x.WAP is a powerful workforce analytics platform. It is a cloud-based SaaS tool that integrates with virtually any and all data sources such as ERPs, WMS, LMS, TMS via APIs and EDIs to create custom dashboards that provide actionable insights that are real-time and make your company a truly data-driven organization. With live data, rich visualizations, and responsive layout, all the wisdom is at your fingertips. Here is a look at our dashboard examples for different business units.
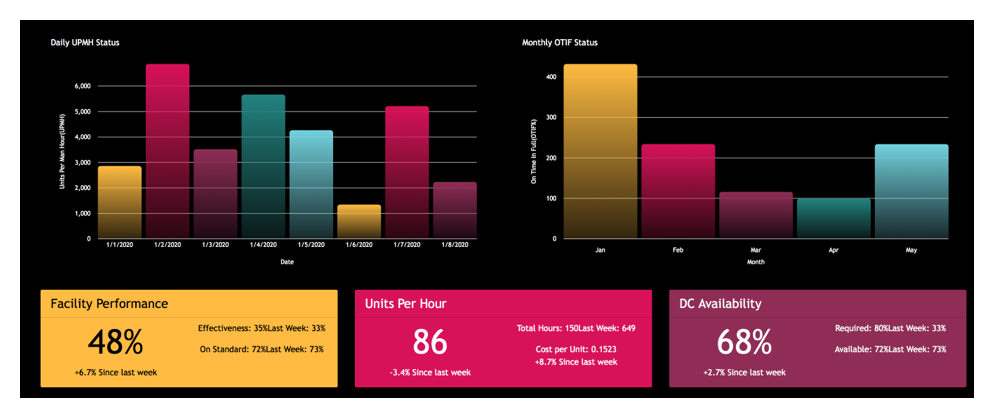
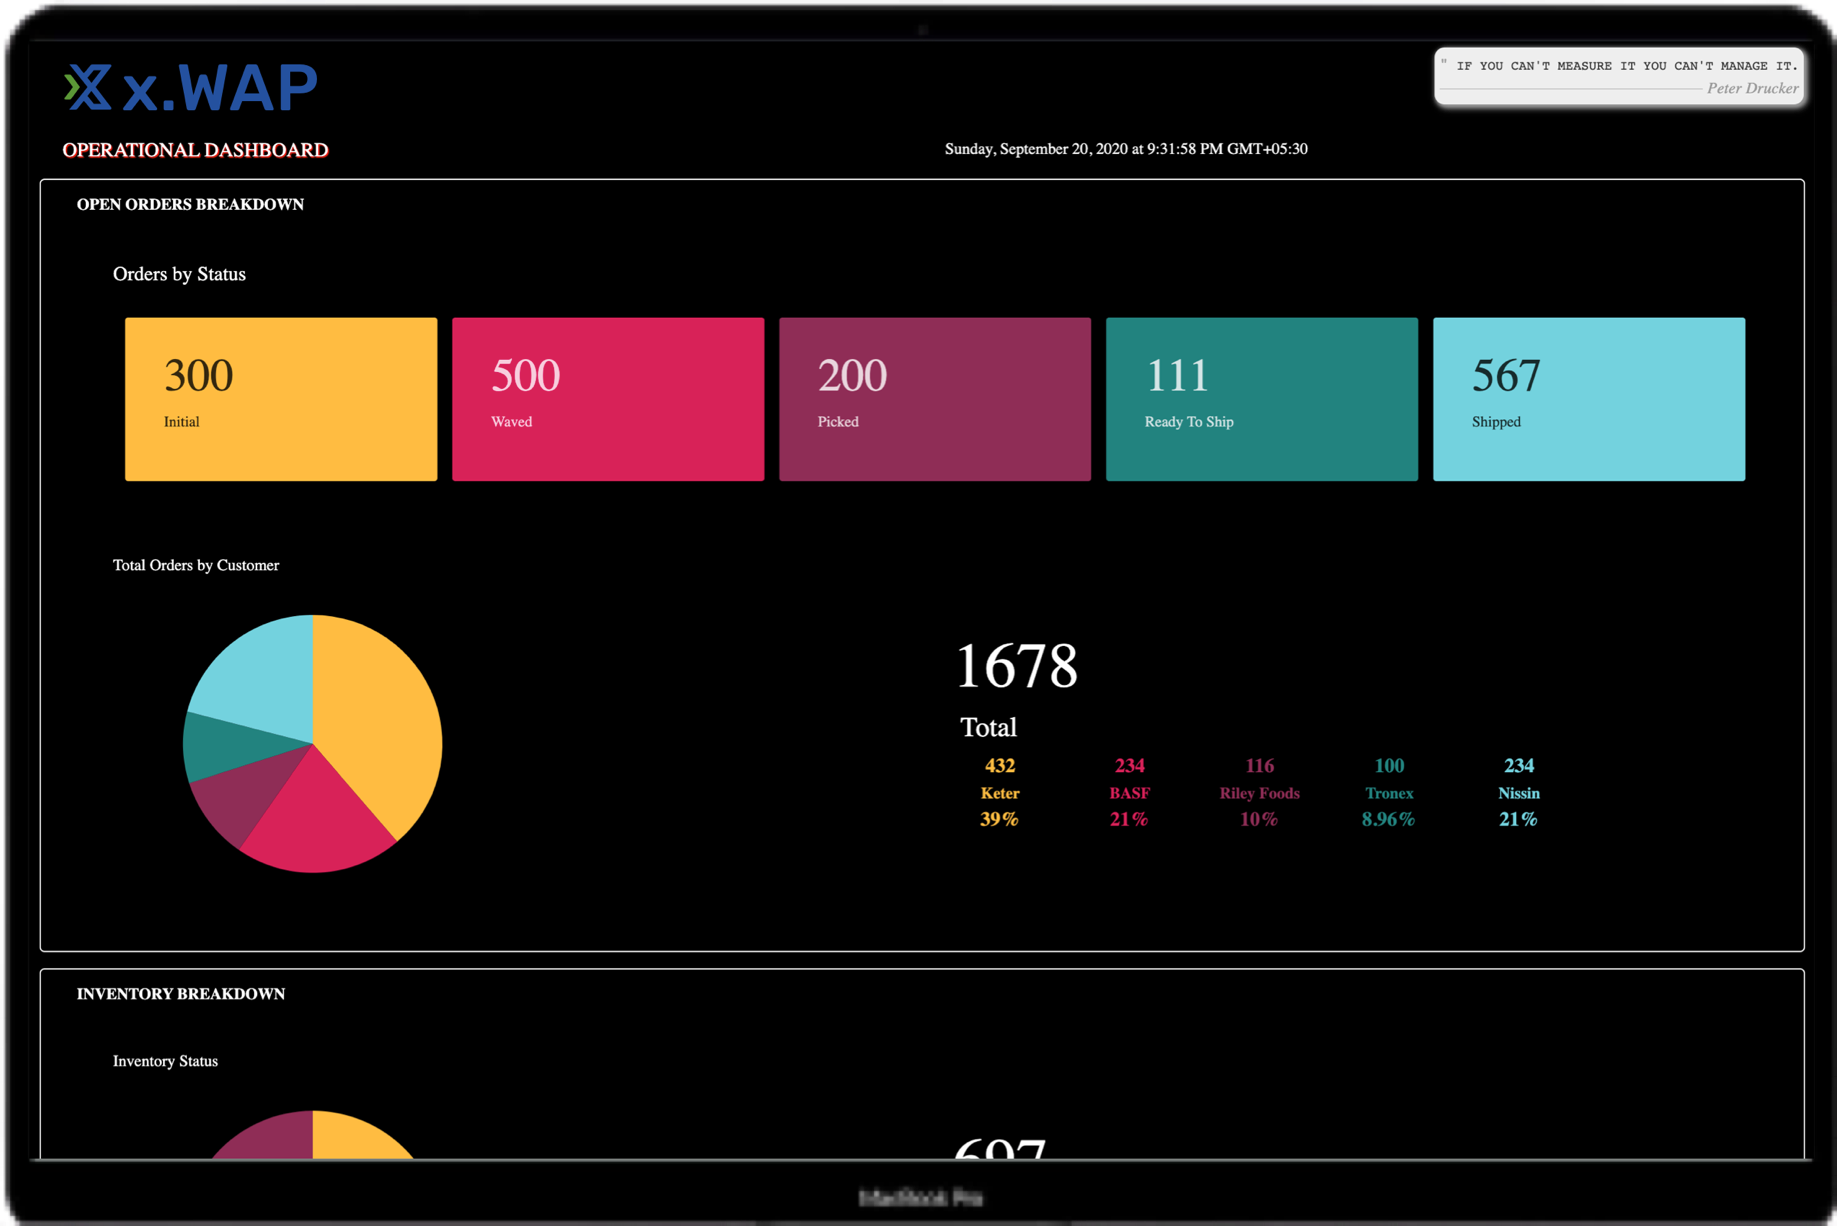
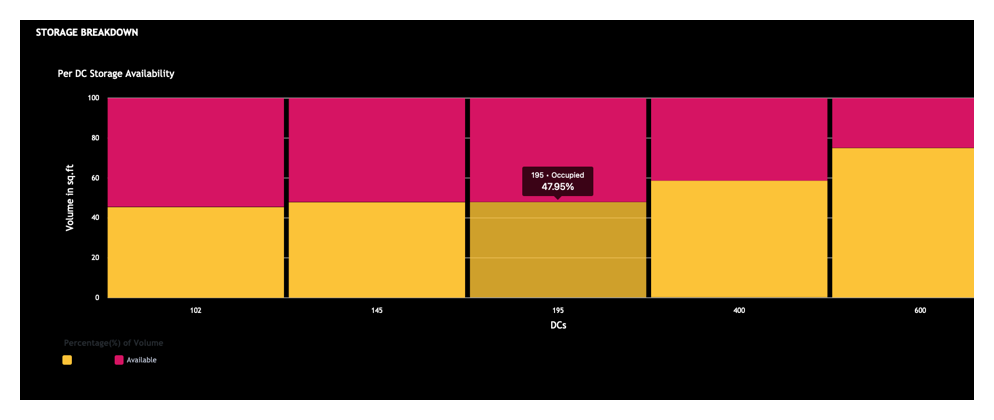
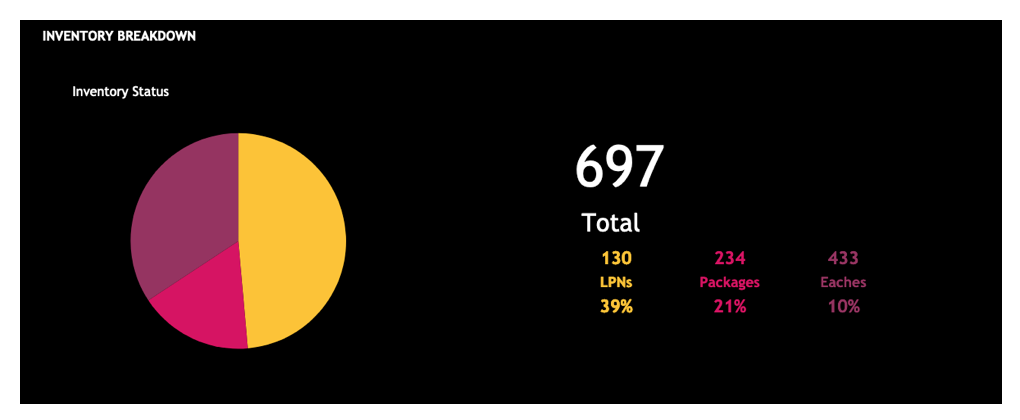
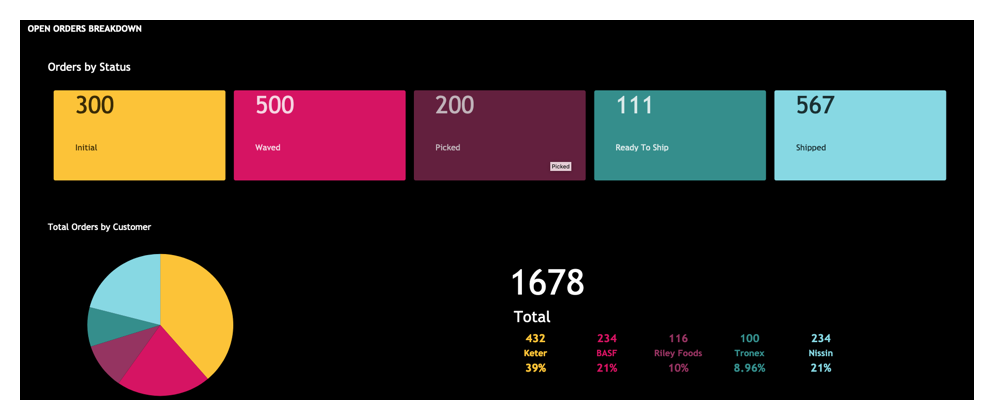
Operational Dashboard
Executive Dashboard
eCommerce Dashboard
Retail Dashboard
Key Features

 Actionable Insights
Live dashboards provide you big picture that will help you get real time insights to make data driven business decisions.
 Customized Dashboards
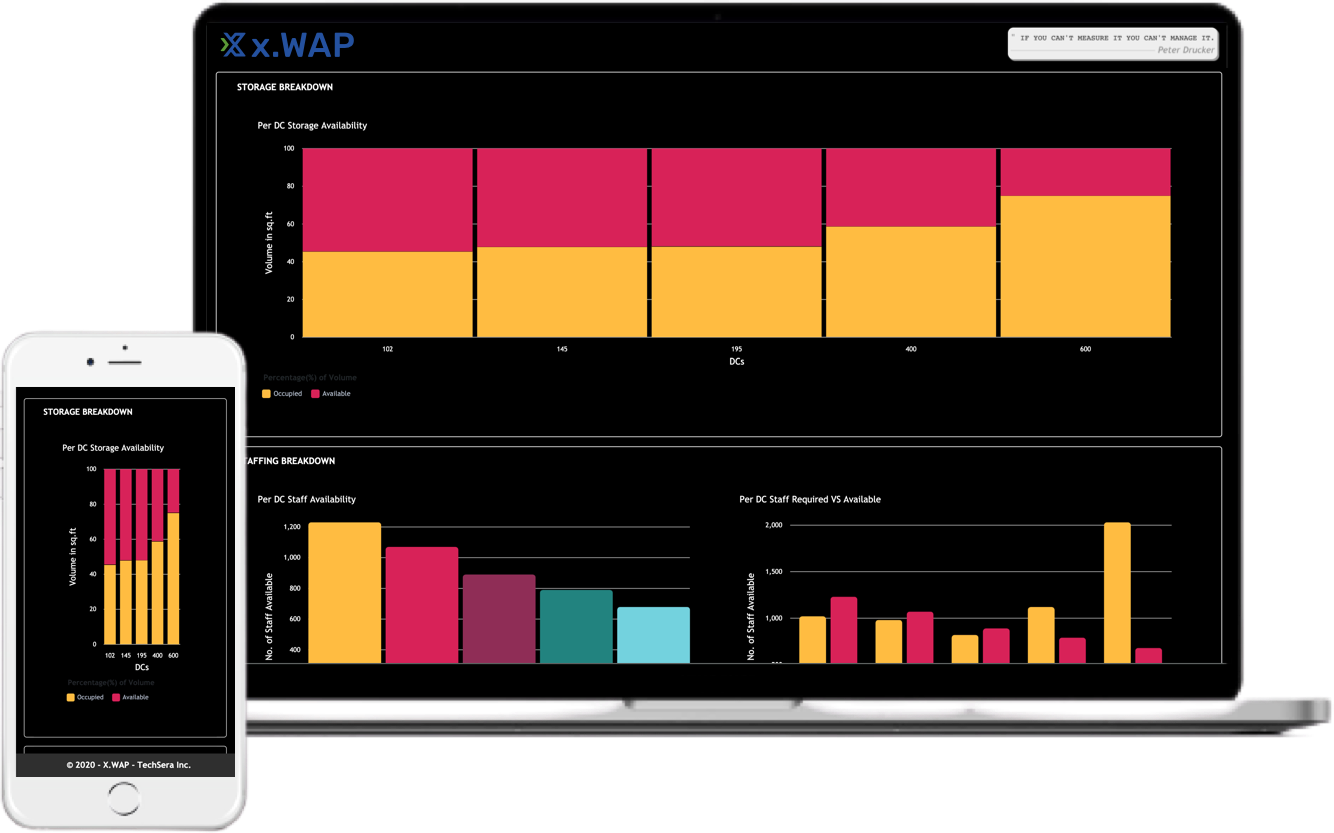
Dashboards adopt to different displays when viewed on TV screens, desktops, tablets, or mobile devices to give you same user experience across any devices.


 Executive Dashboards
Secured access-based business dashboards delivered to executive and management leadership to provide high level analytics that will help drive decisions.
 Responsive Design
Dashboards adopt to different displays when viewed on TV screens, desktops, tablets, or mobile devices to give you same user experience across any devices.

 Prebuilt Integrators
x.WAP integrates with all the standard data warehouses and offers integrations with any data source whether cloud based or legacy systems. Custom connectors can also be integrated.
 Visuals
Visual information helps decision makers make informed decisions for business. Data represented into graphs, pie charts, column charts, and other rich visualizations provide clarity and cuts down on time spent in compiling and analyzing reports.

How it works ?
Pricing plans
One Plan, All Features
 Custom Dashboards
- Executive Dashboards
- Operation Dashboards
- eCommerce & Retail Dashboards
- Unlimited Users
- Cloud Deployment
- Prebuilt Integrators
- Pre-built Data Integration
- Real Time Data Refresh
- Web and Mobile Access
- TV Display
- Custom URL
- Rebranding with your Logo
- 24x7 Email/Call Support